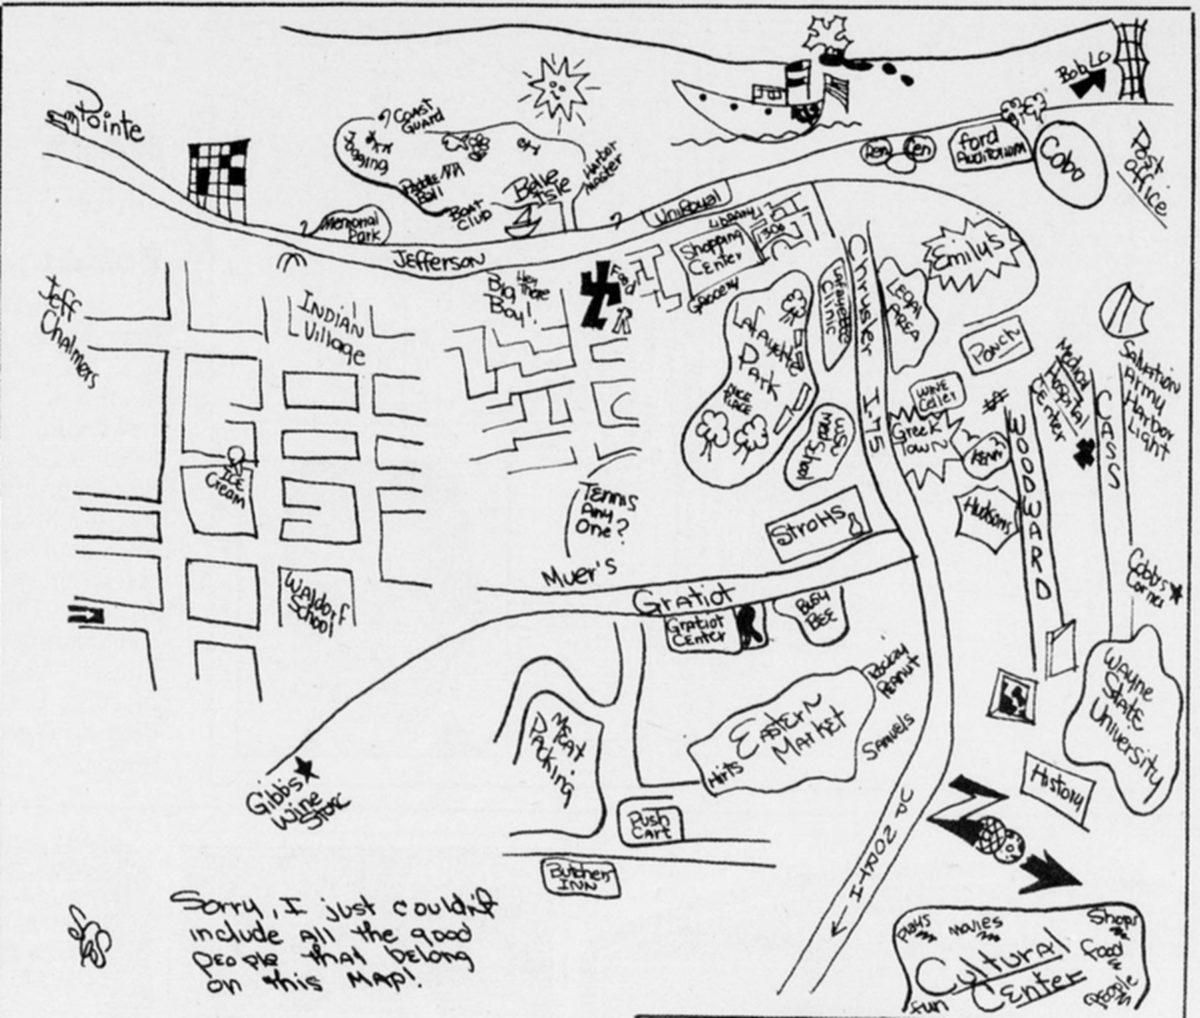

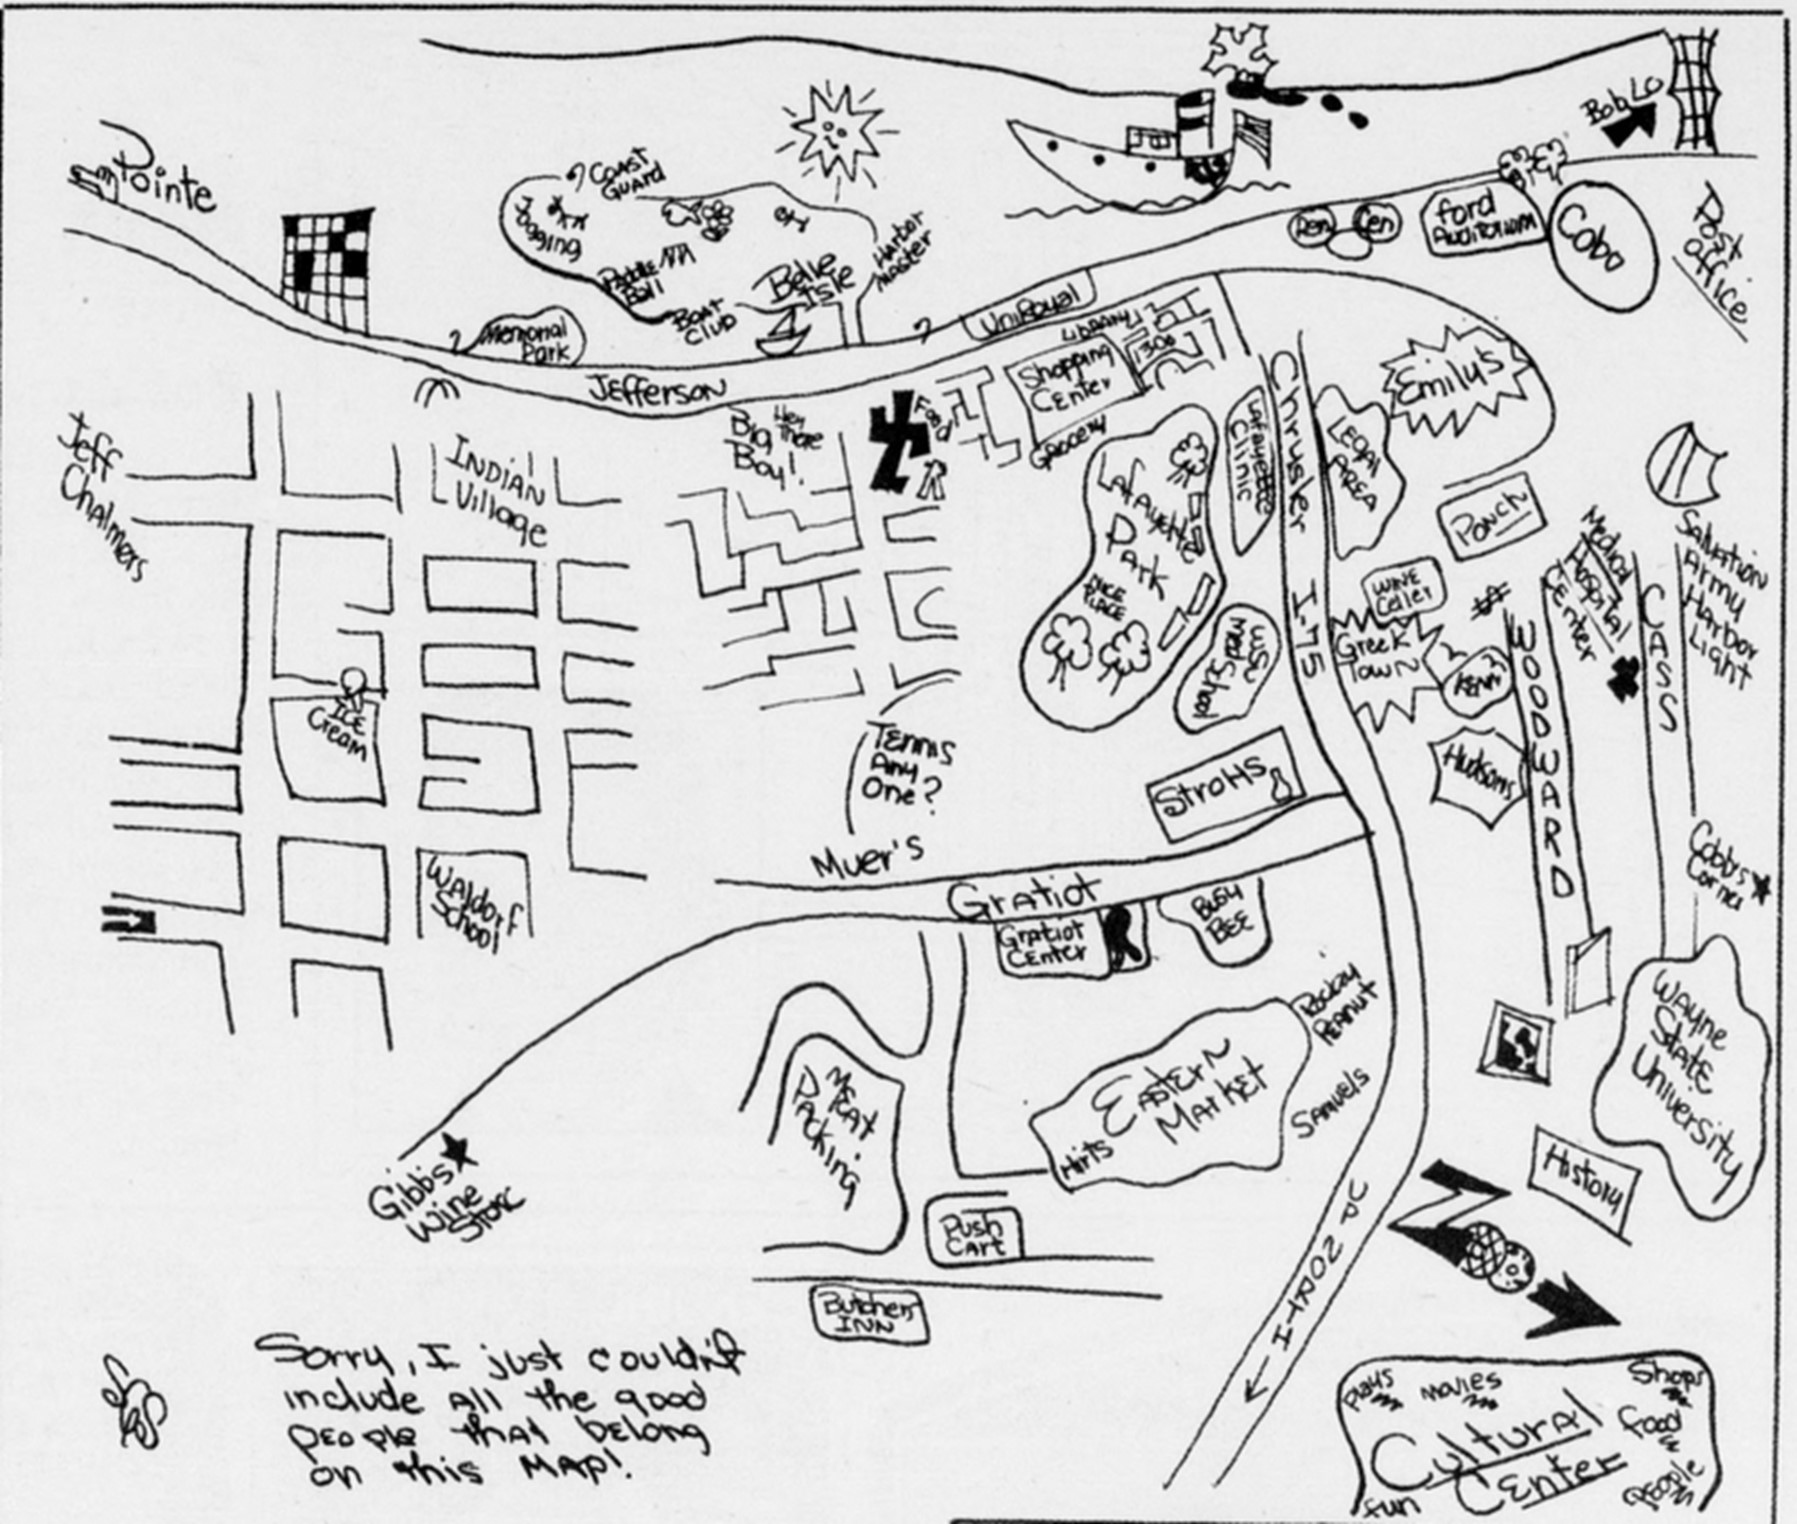
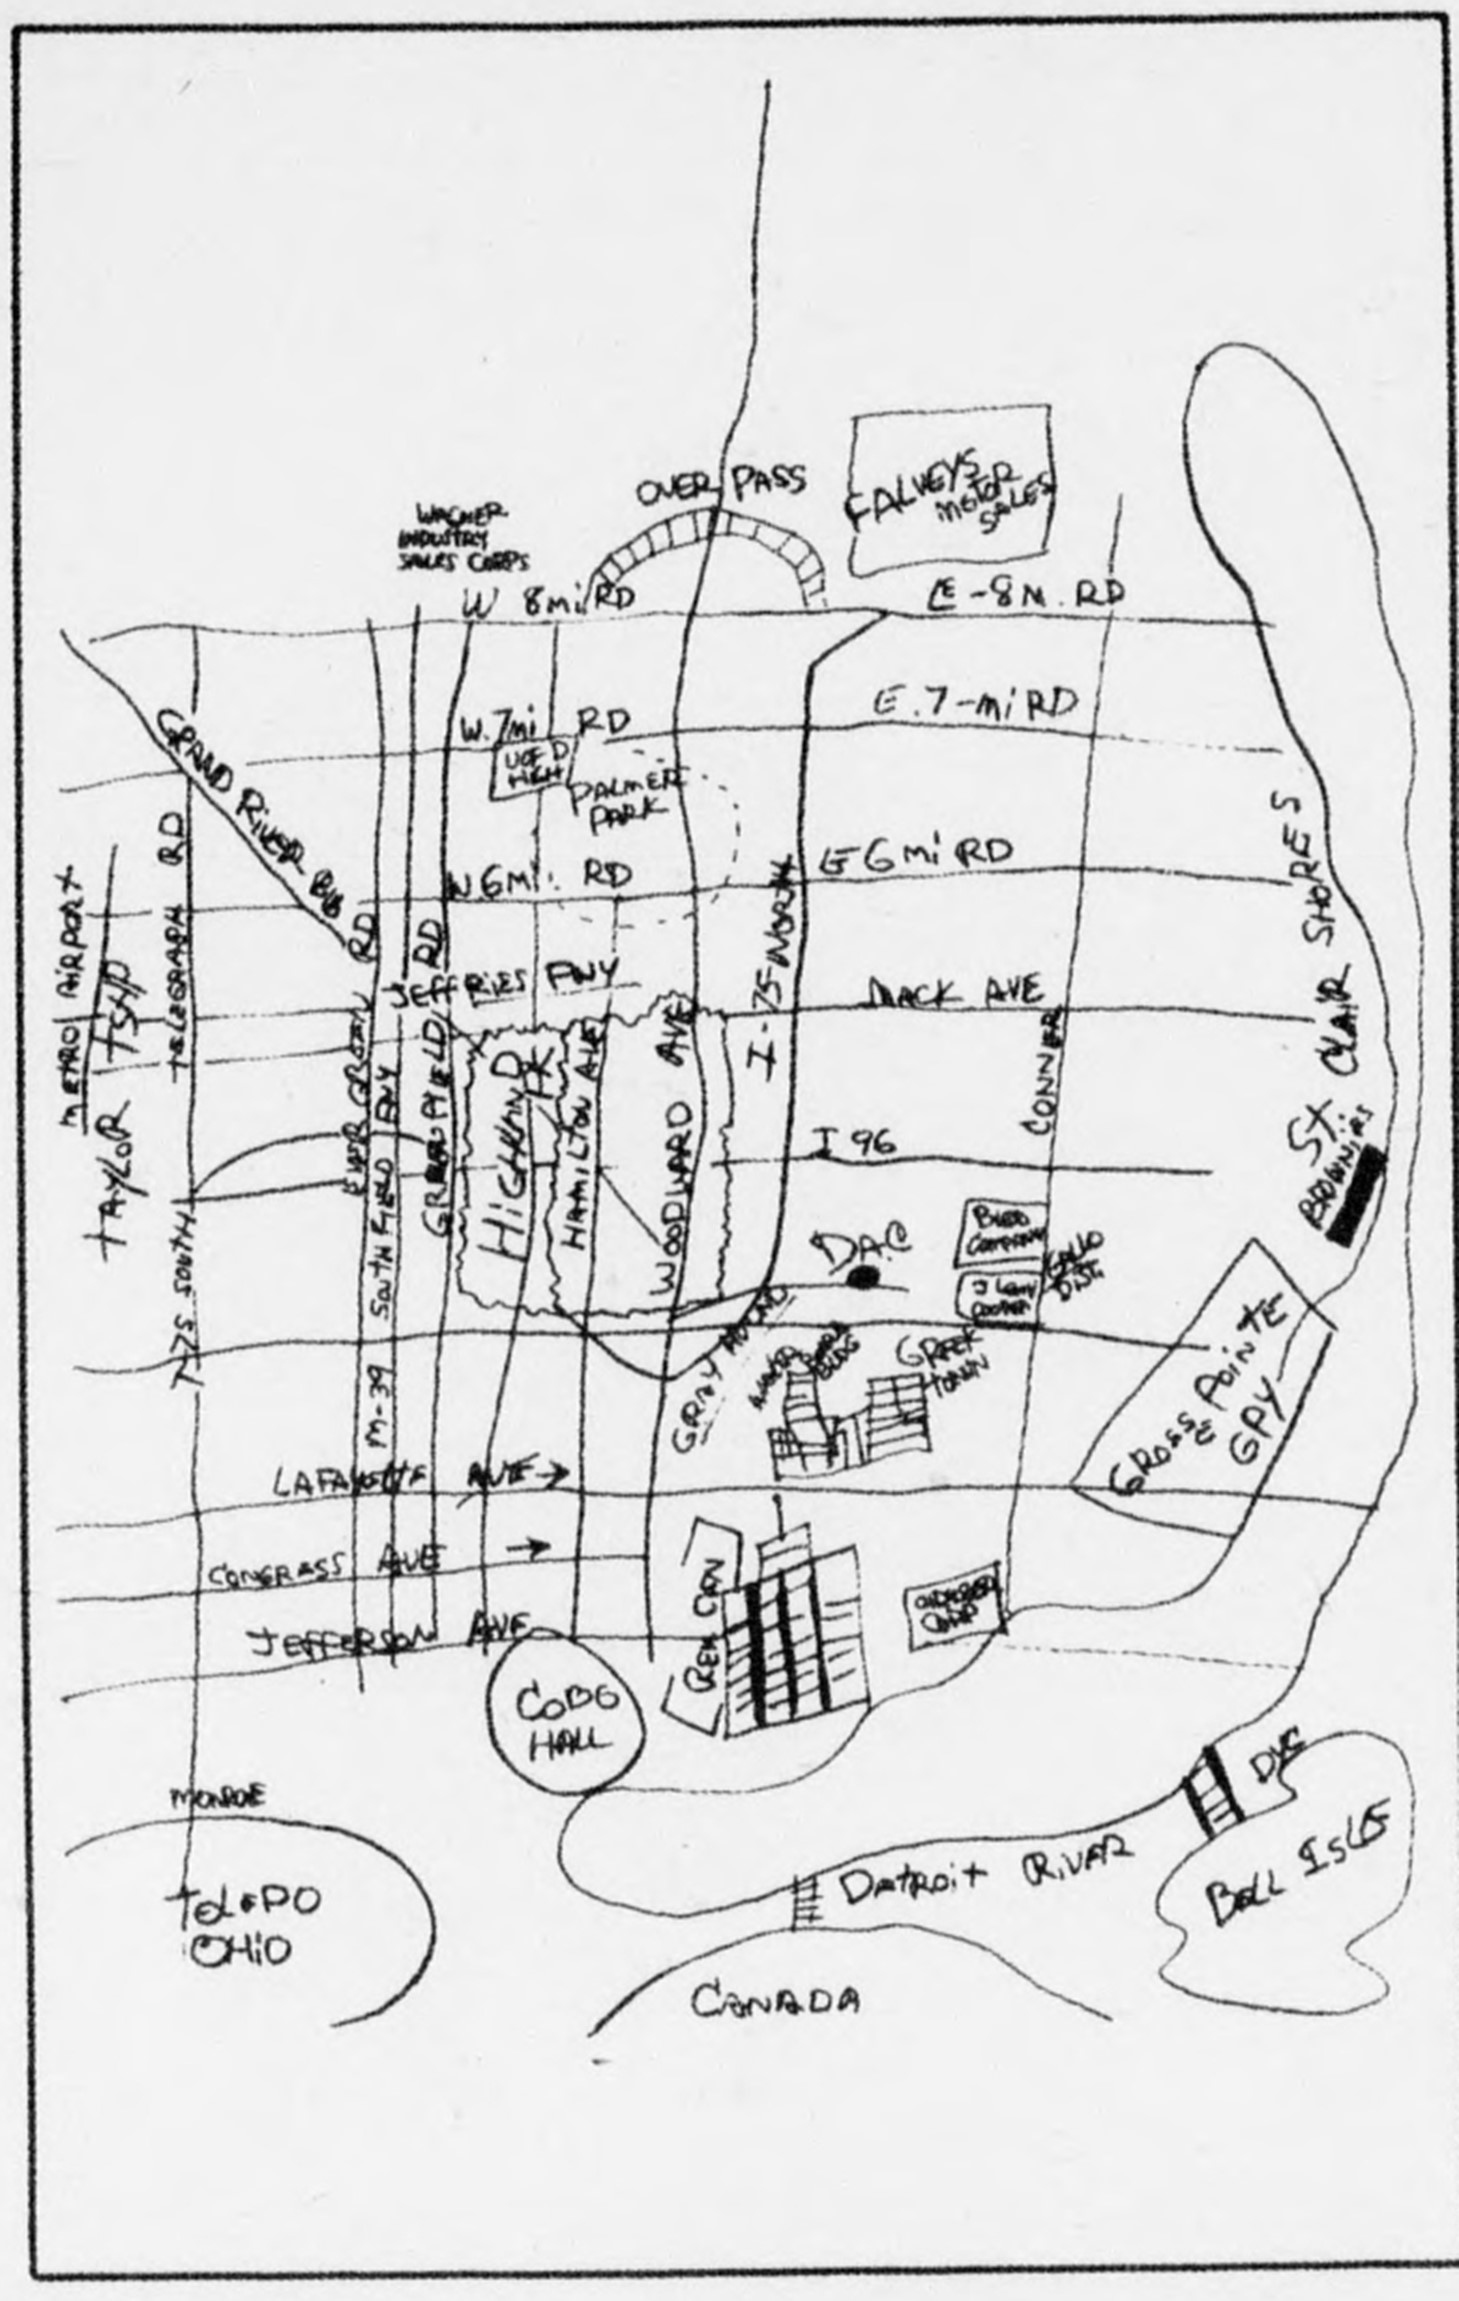
In 1978, the Detroit Free Press asked readers to submit mental maps of the city as part of a discussion around the many different ways that people “see” Detroit.
Again the Detroit River and prominent roads of Detroit feature in these mental maps. A number of the hand drawn mental maps placed the Detroit River at the top of the paper (South as up), which was a fascinating alternate view than what the standard “official” map of the region would depict.
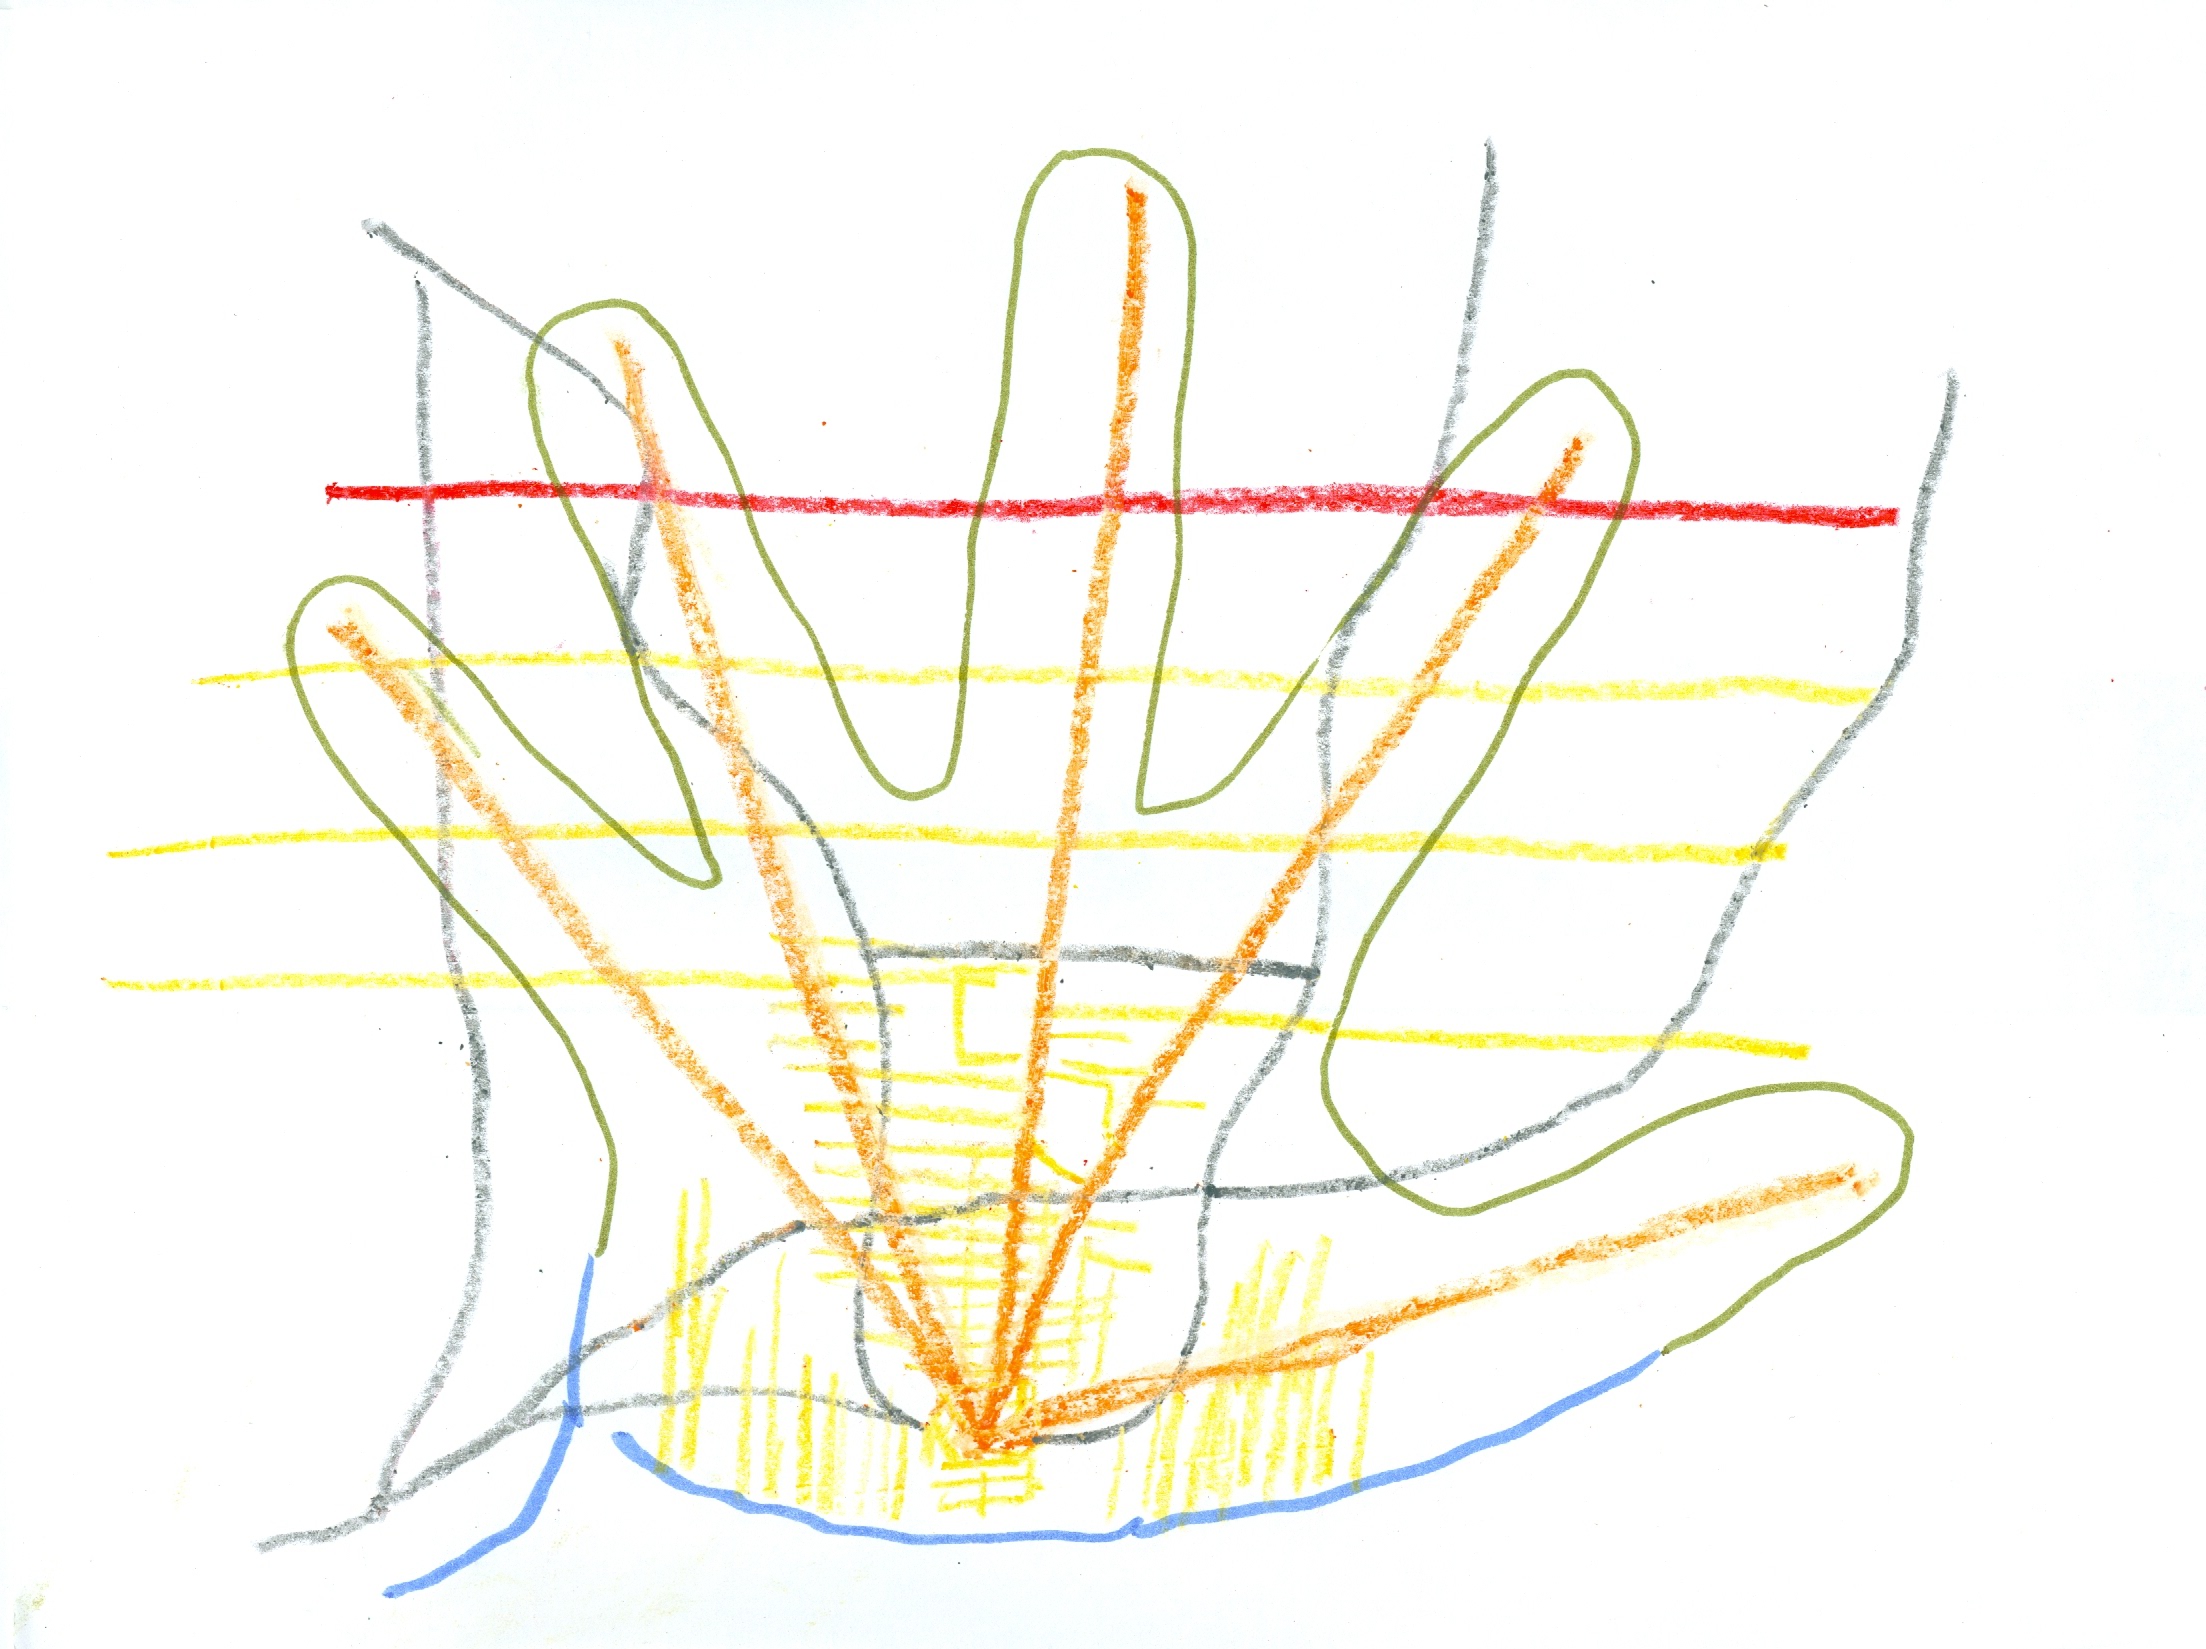
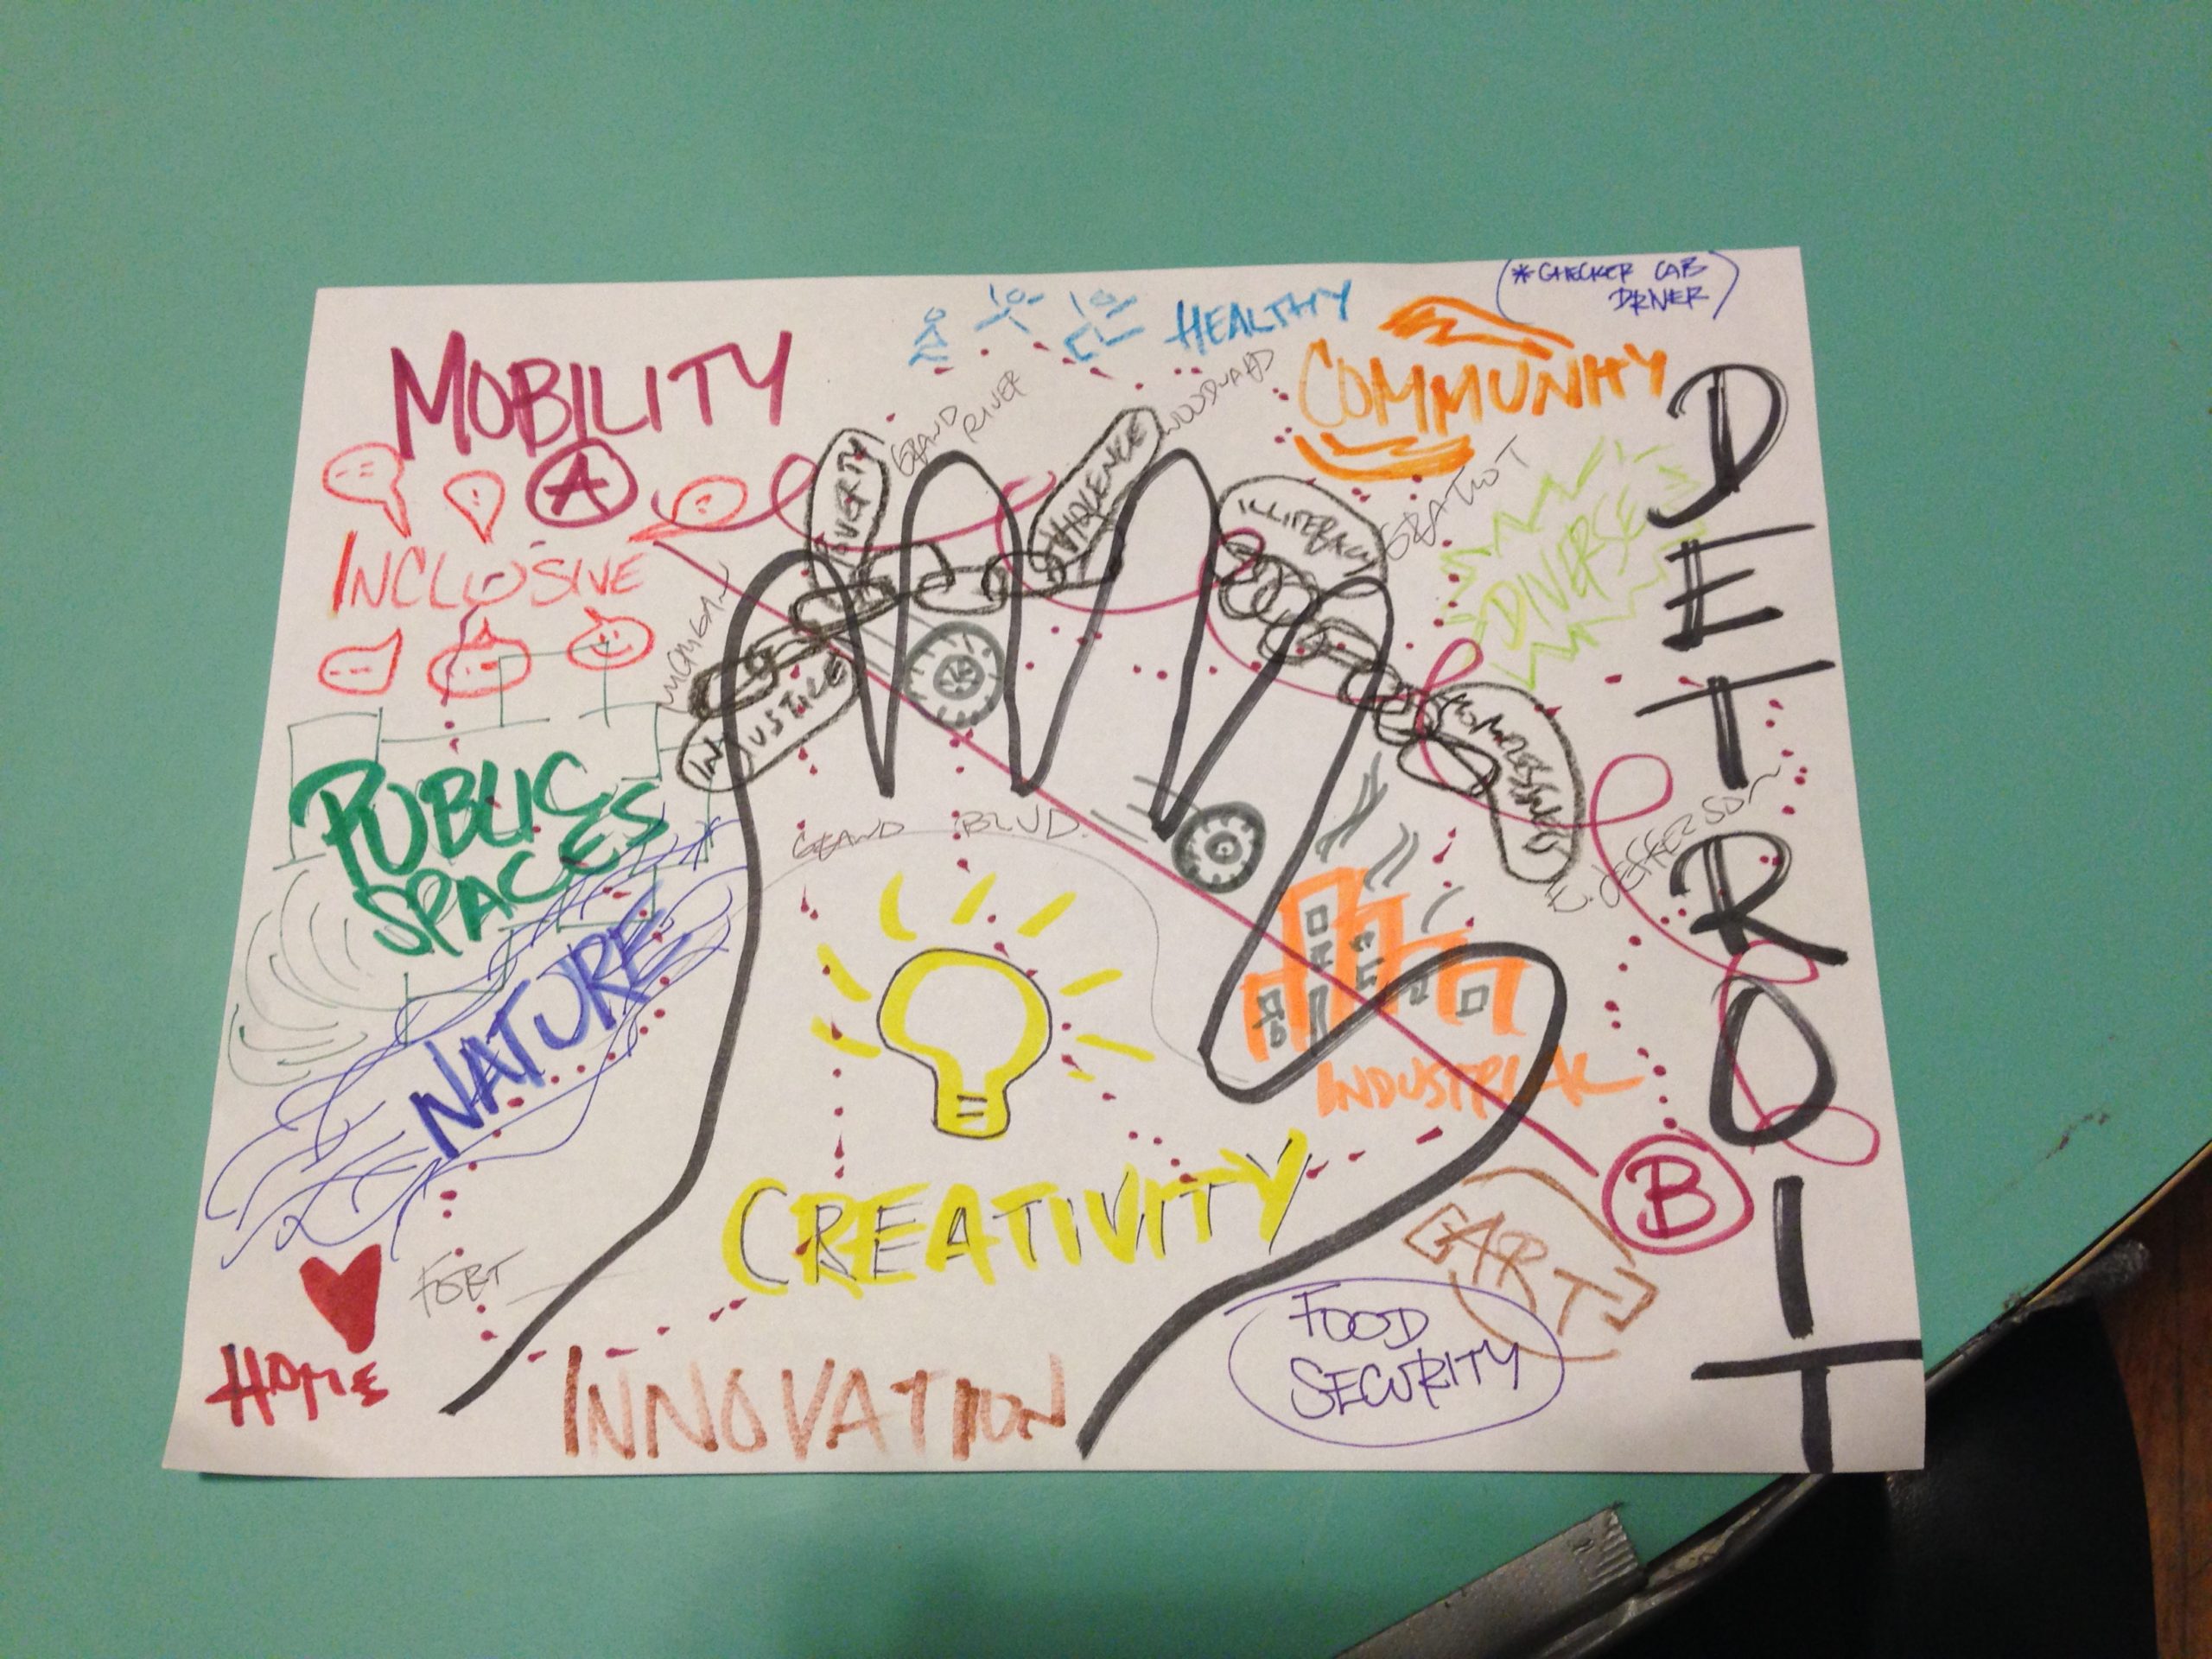
Participants of the “Data, Mapping, & Research Justice” workshop that I run through Co.Open and Allied Media Projects (AMP) spend time creating analog maps of Detroit using only their hands and their creativity to tell their stories. They agreed to share their maps here for all to see. I was particularly impressed by their use of emotions and social issues related to their spatial/ geographic awareness of Detroit.
At the end of our first class in 2014 we held an excellent discussion on research justice and how to balance narrative information with “hard” data; numbers and statistics. We tapped into the long running debate on the merits of qualitative data versus quantitative data. Our conclusion was that both are important to use and often times quantitative data can open the door for policy makers to begin listening to the qualitative stories and experiences of the people behind the numbers.
There are pockets of development in Detroit, but they aren’t connected
The suburbs are segregated enclaves surrounding the city
The East/ West divide highlights areas of Detroit we may still not know and people we haven’t yet met.
St. Louis to Detroit, similarities in segregated metropolis
Don’t forget Highland Park and Hamtramck
A lot of hope for Detroit as it is growing
Water is a critical need for everyone
Pockets of investment and areas of need
Boundaries of and within Detroit that limit us, need to reach across
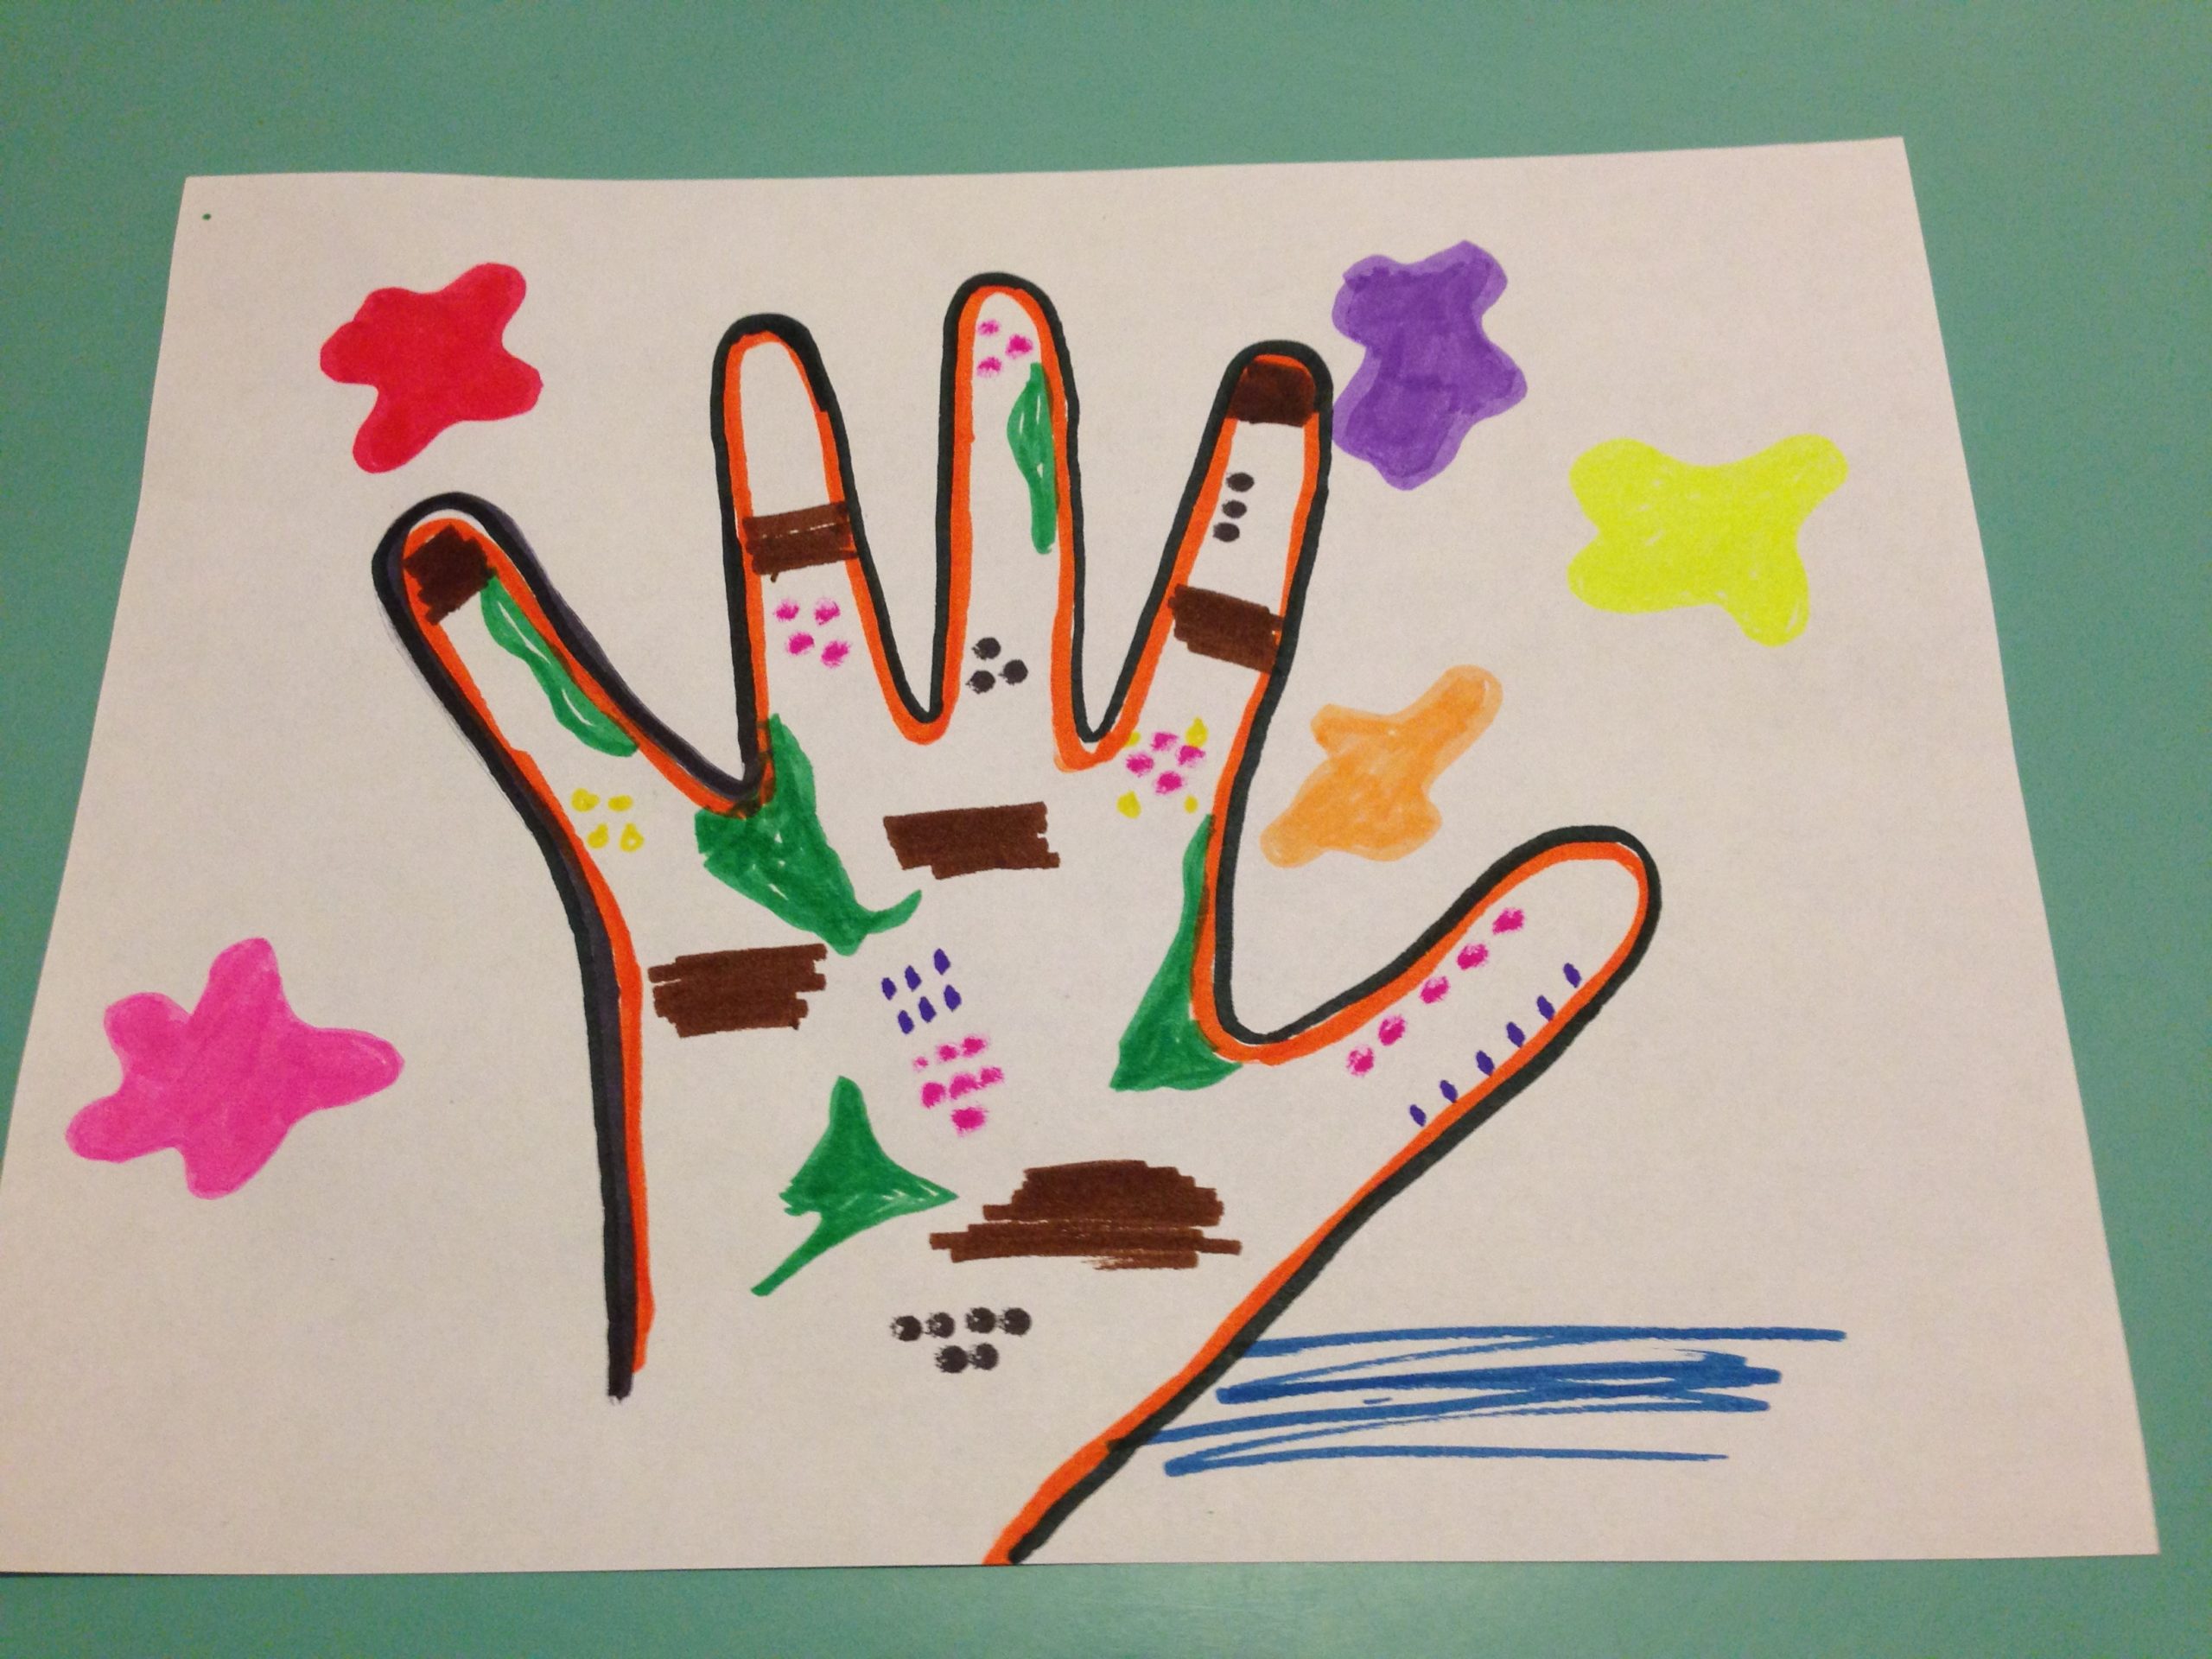
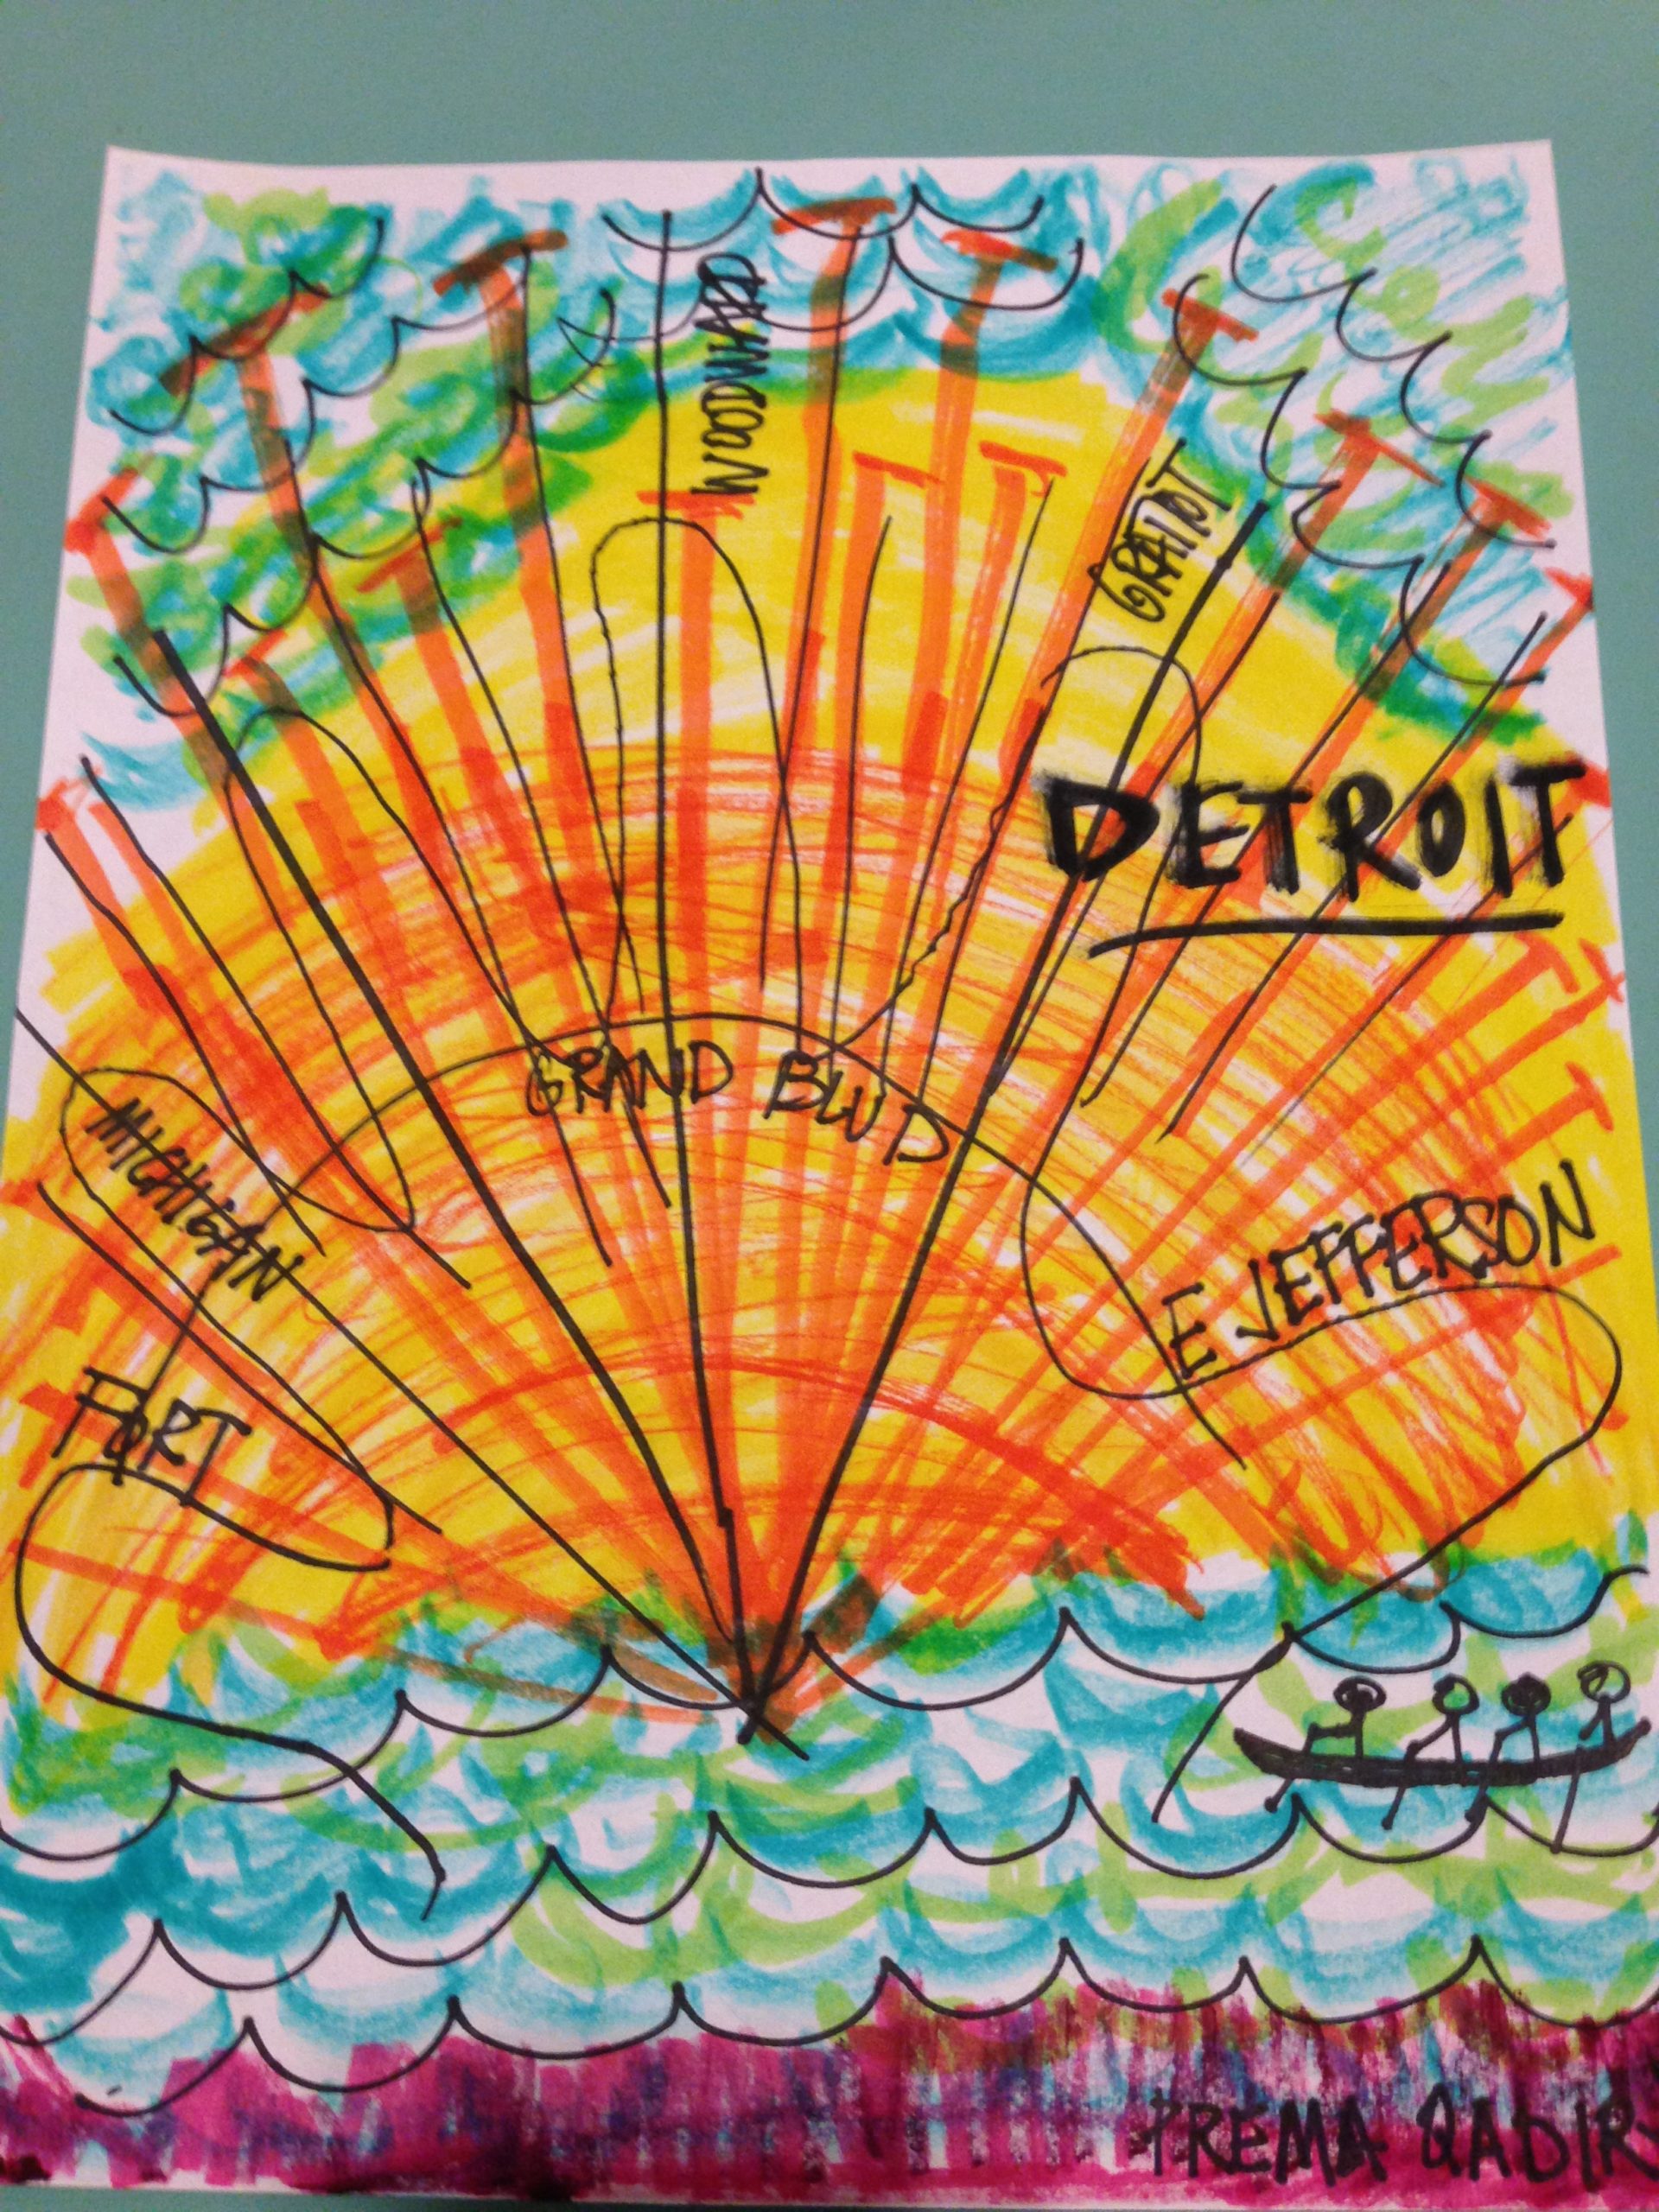
Nothing beats a
good mental map.
Nothing.
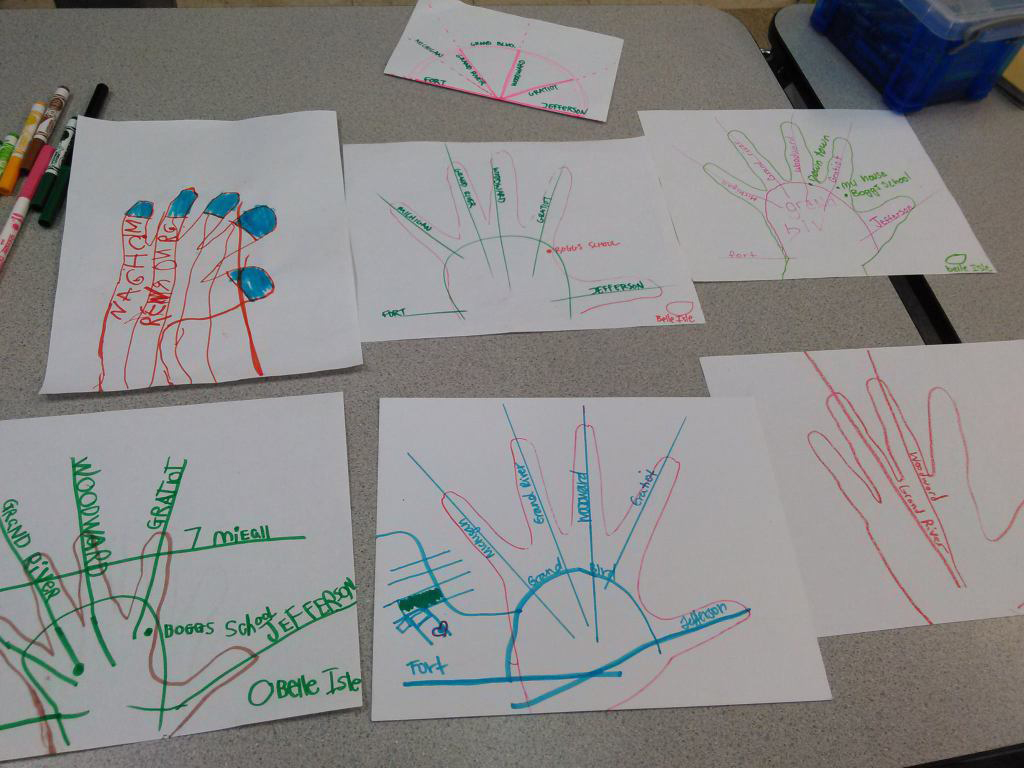
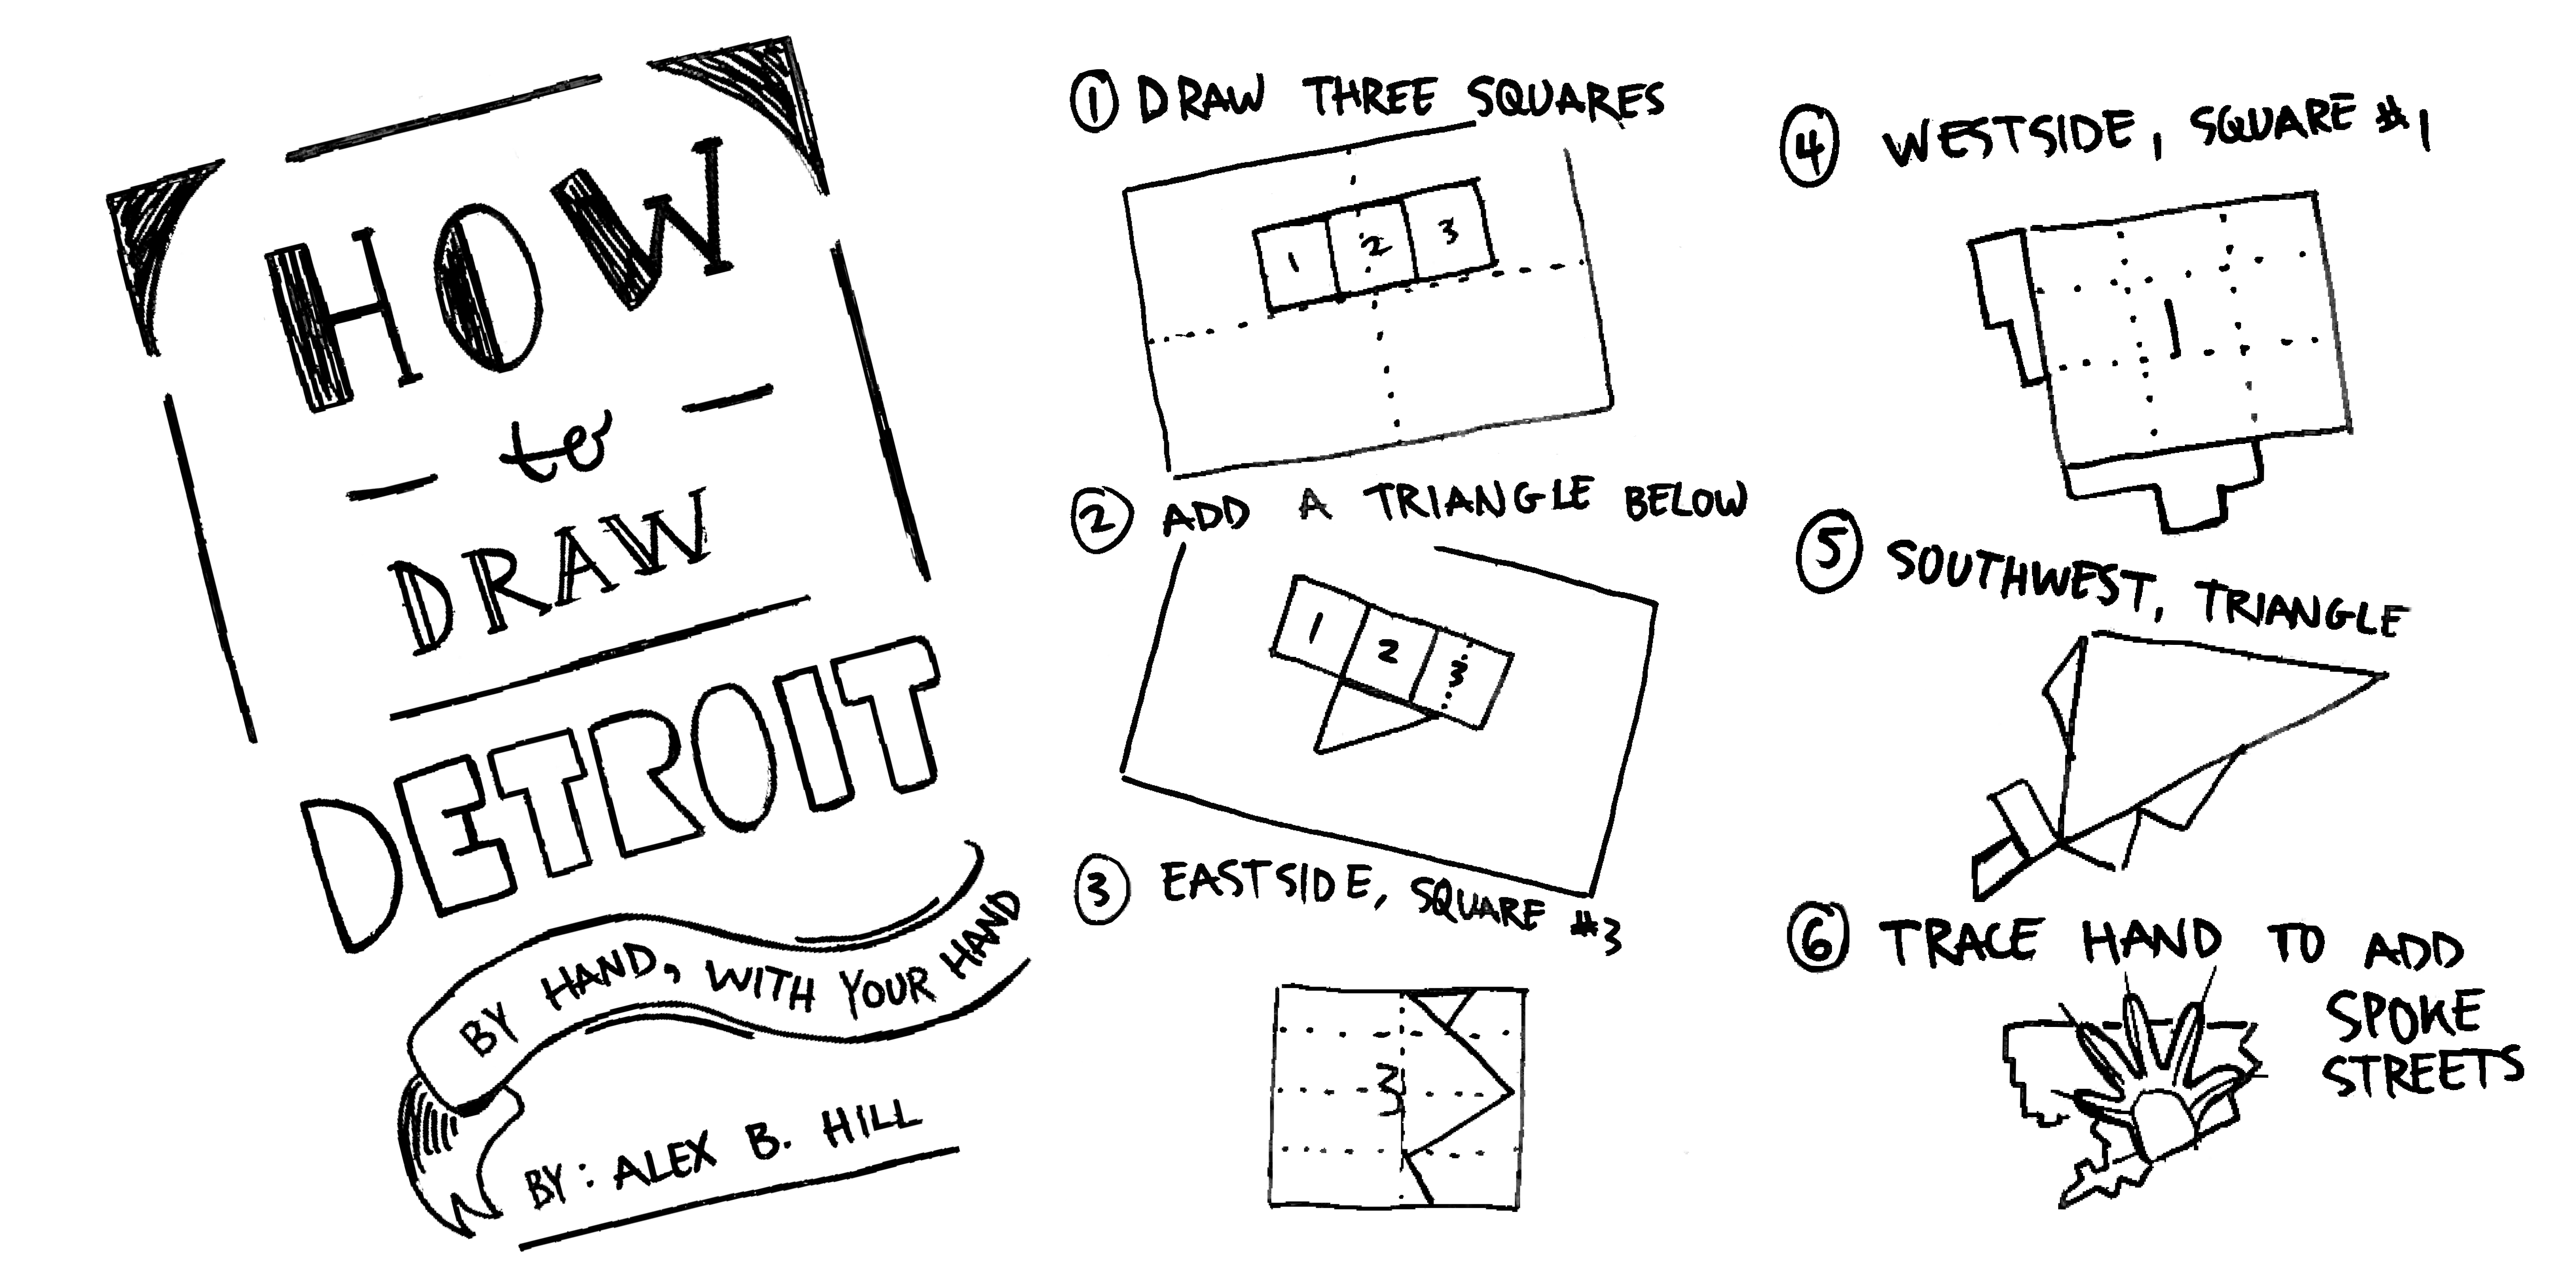
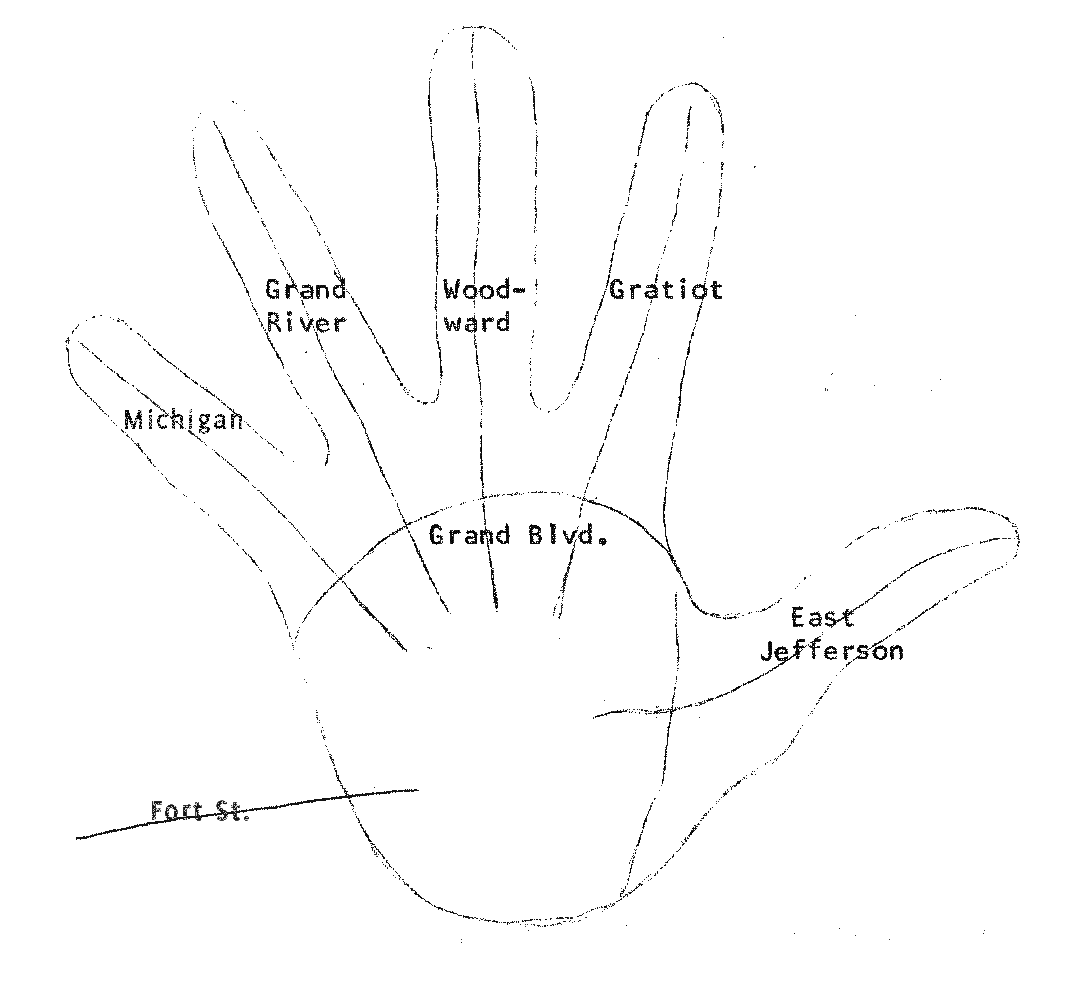
I’ve been participating in the Data Discotech’s put on by the Detroit Community Technology Project (DCTP). In a 2016 event held at the Boggs School, we shared the hand map example to help students understand the geography of their city.
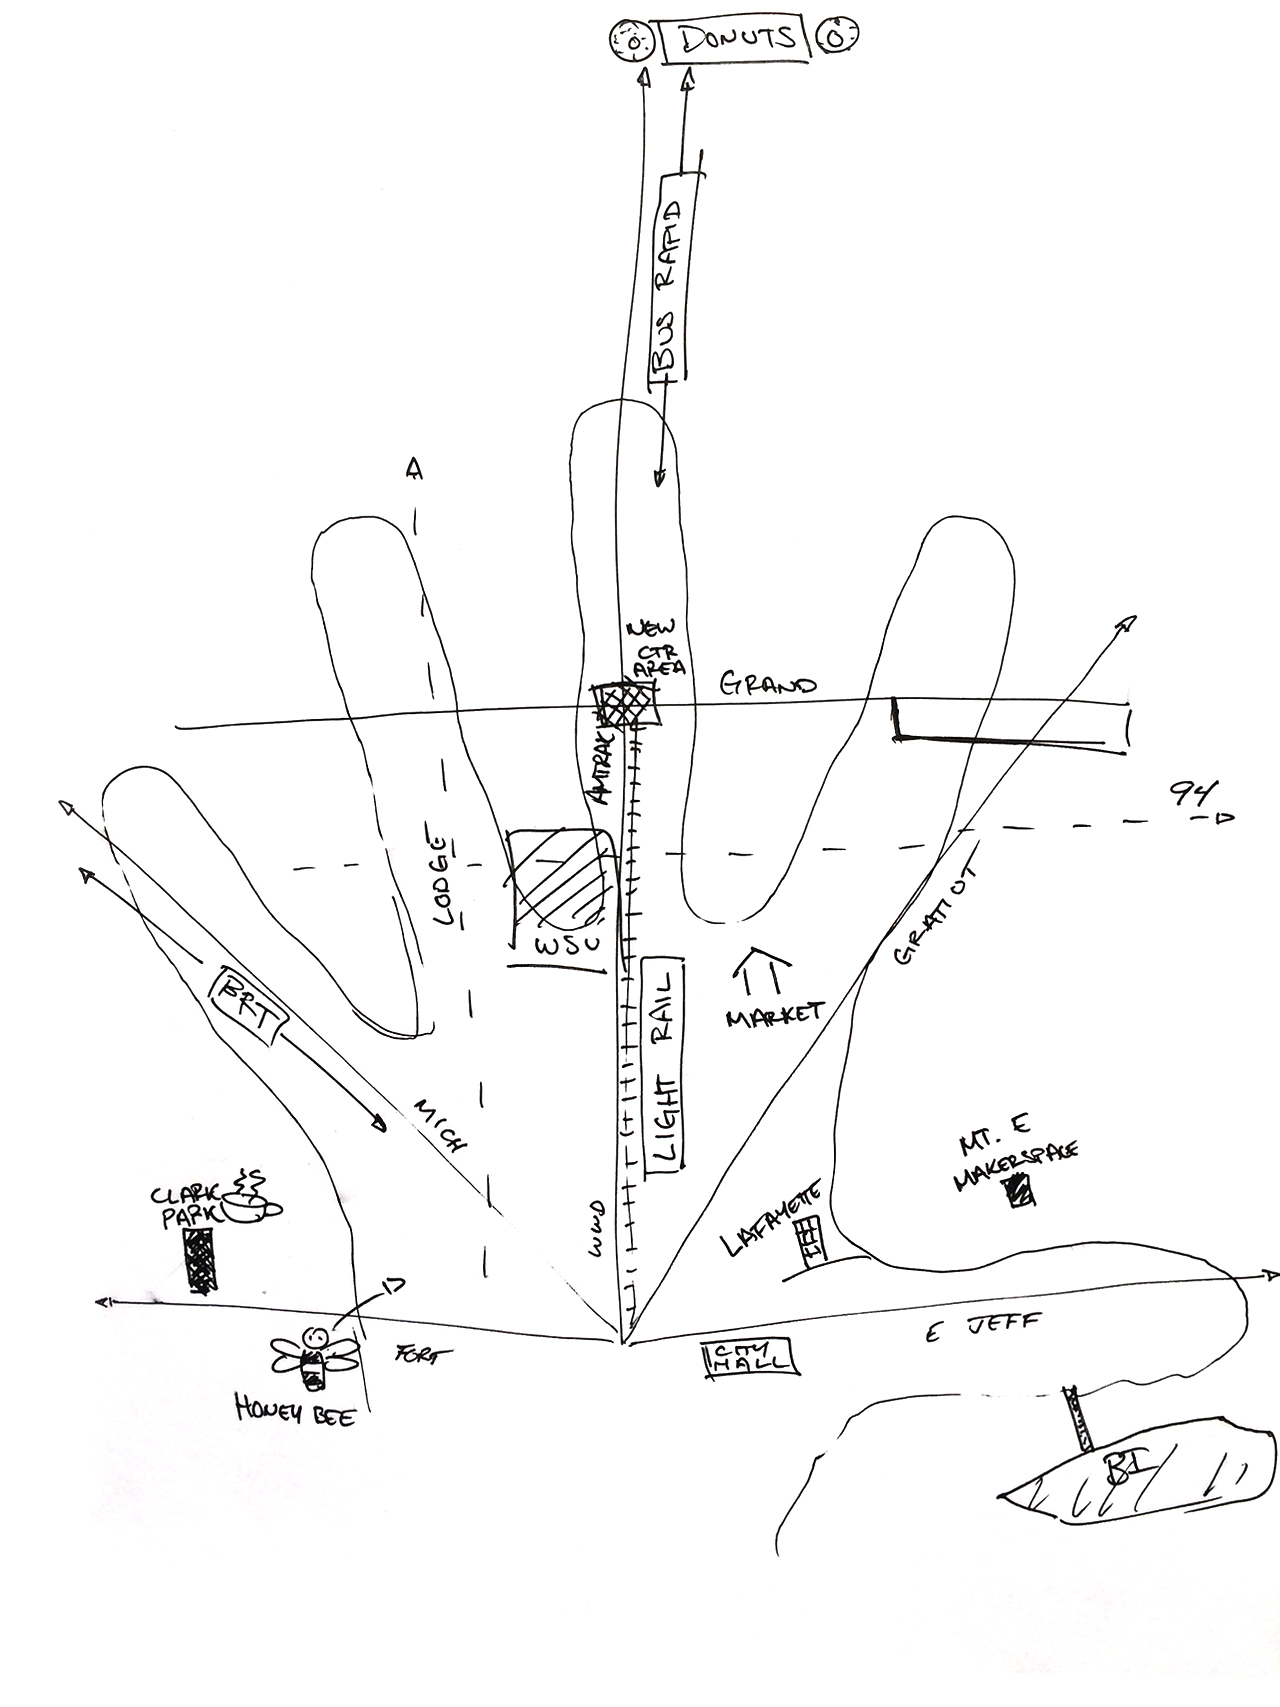
Hand maps are rarely accurate, but help build a conceptual understand of the world around us. The Boggs students taught us as much about the geography of Detroit as we hoped to teach them about spoke streets.
Detroit is a big city with a deep history and so many old and new things happening all the time that it can be near impossible to give anyone a “brief” introduction to the city.
If you’ve ever talked with me, you know that I always start with a hand map. I find it gives people a quick relatable reference. People know more than they think and when they can place the Fisher Building related to Belle Isle they are on track.
The funny part of the hand map is that it often focuses geography within Grand Boulevard. Most people try to use their whole hand to represent Downtown and Midtown. This becomes another helpful reference lesson that there is so much more to Detroit beyond the redeveloping urban core.
